I think you’ll agree with me when I say that a marketing strategy is incomplete if it doesn’t address the digital channels.
The average marketing spend increased from 6.4% in 2021 to 9.5% of company revenue across almost all industries in 2022, according to Gartner’s annual CMO Spend and Strategy Survey. This only goes on to show the importance of channels like social media, content, SEO, video, and more.
If you are a numbers nerd or love data, you’ll love these digital marketing statistics that we’ve curated from over dozen of studies and research.
SEO Statistics 2023
1. As of July 2022, Google holds 84.08% of the global desktop search engine market share.
2. Organic search results that rank on page 1 of Google contain an average of 1,447 words.
3. In 2022, technical SEO was the highest priority for SEO professionals at 15%.
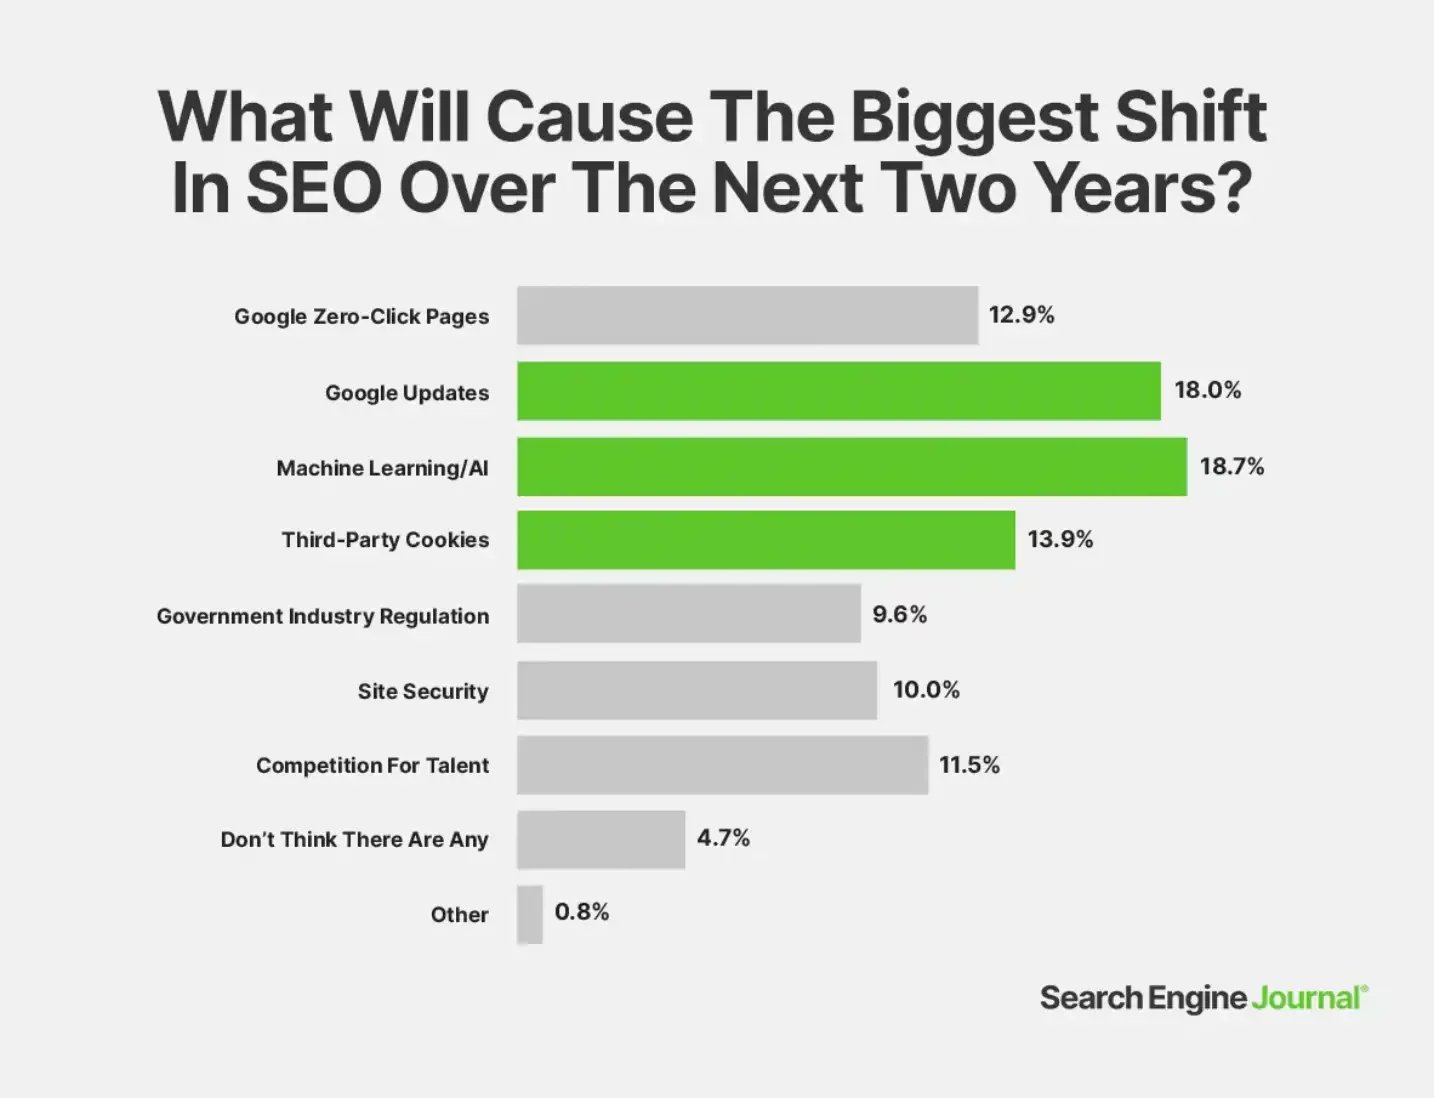
4. Machine learning/AI will cause the biggest shift in SEO over the next two years.
Source: SEJ
5. 77% of people use search engines (Google) to start their patient journey.
6. Updating an existing title tag with an SEO optimized one can increase page clicks by more than 437%.
7. Longtail keyword searches enjoy a 3-5% higher CTR in the organic search results
8. The #1 result in Google has a CTR of 27.6%.
9. Page one results enjoy 95% of search traffic.
10. 89% of marketers say SEO is successful.
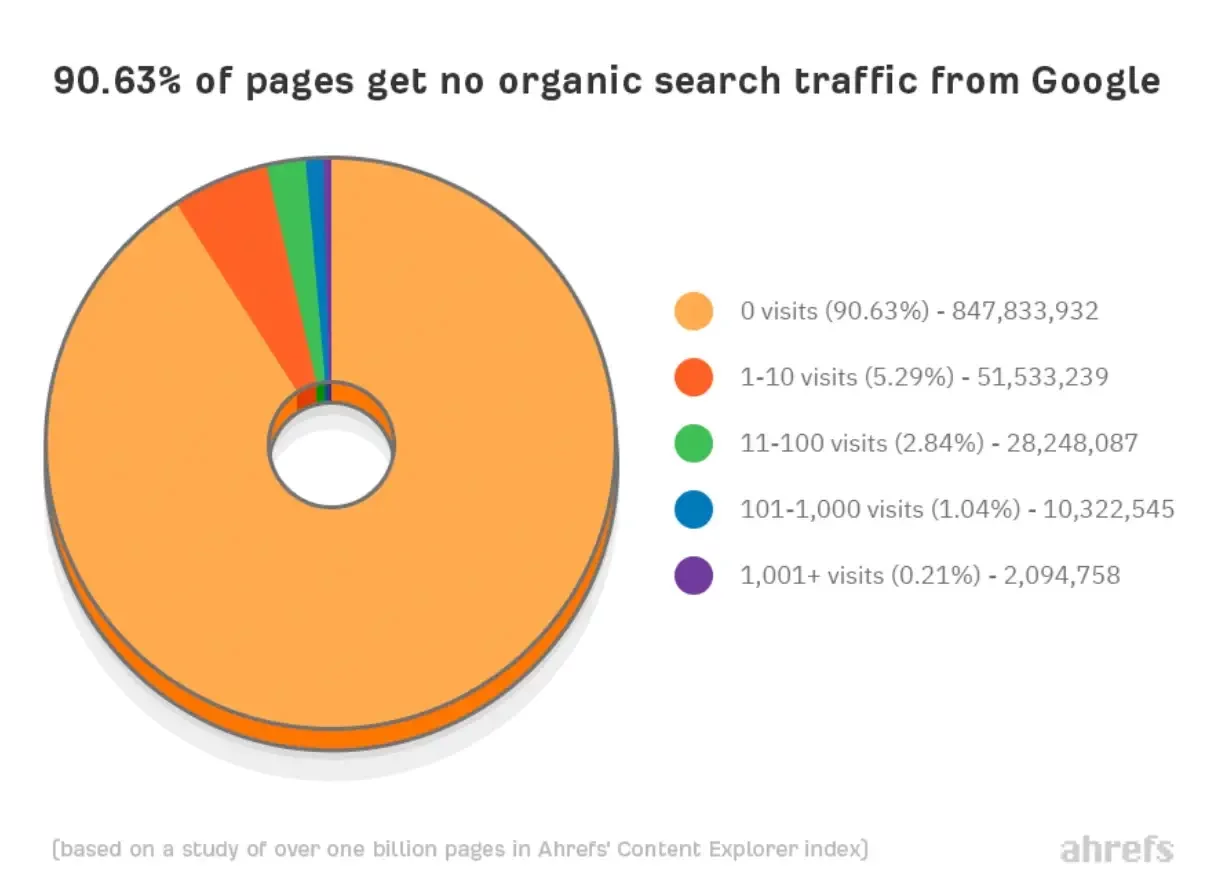
11. 90.63% of pages get no organic search traffic from Google.
Source: Ahrefs
12. There has been 500% growth for phrases like “near me now.”
13. 56% of businesses allocate less than one-quarter of their marketing budget to link building.
14. 86% of businesses use video as a marketing tool.
15. 92% of marketers continue to value video as an ‘important part’ of their marketing strategy.
16. 70% of marketers see SEO as more effective than PPC.
17. 25.02% of top-ranking pages don’t have meta descriptions.
18. 70% of clicks in Google search results go to organic, with 30% going to AdWords.
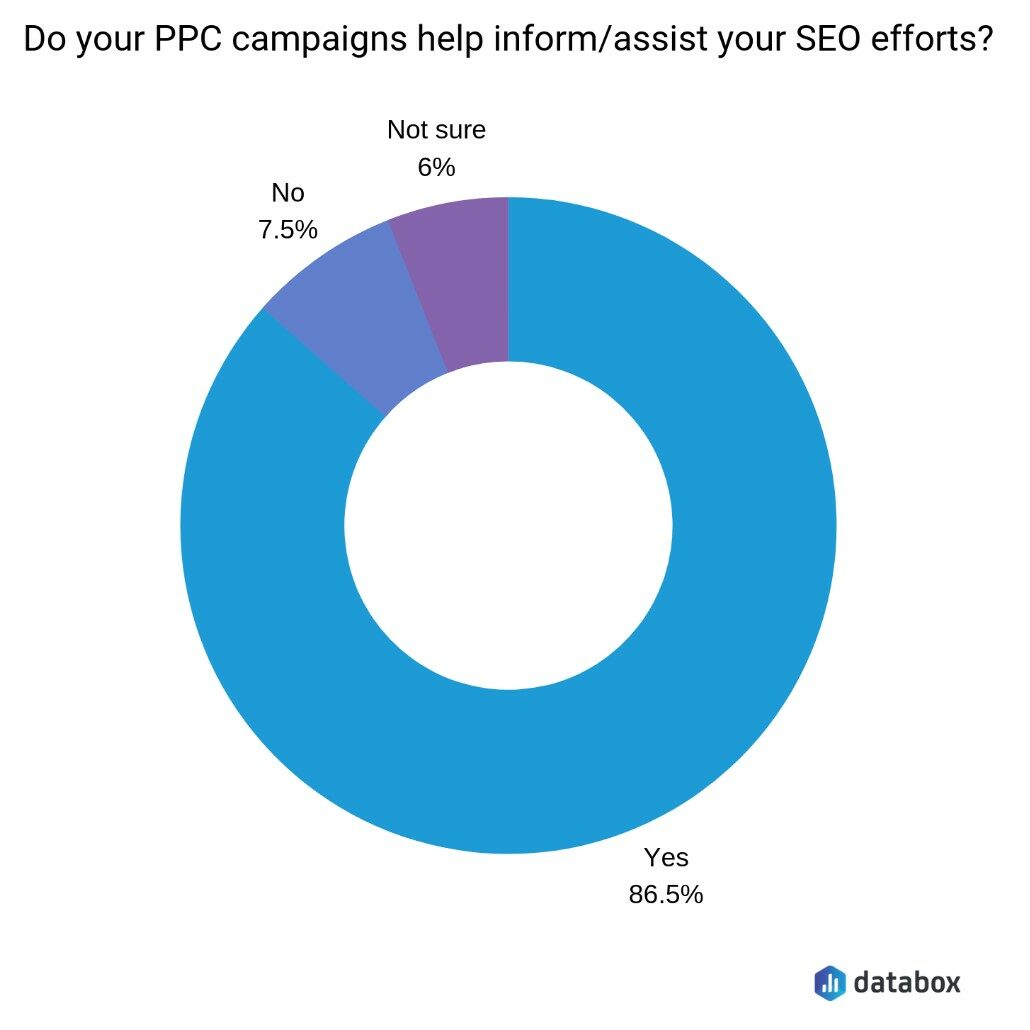
19. 86.5% of businesses say that PPC campaigns help inform/assist their SEO efforts.
Source: Databox
20. Search engine optimization can increase the business value of a blog visit by 429%.
21. The average page’s age that ranks on the first page is 2+ years.
22. 55% of businesses invest in professional SEO services.
23. Updating an existing title tag with an SEO optimised one can increase page clicks by more than 437%.
24. Relevant searches influence 39% of people to make a purchase.
25. 75% of people never scroll past the first page of search engines.
Social Media Statistics 2023
26. 4.9 billion people are using social media as of 2023.
27. 60% of the global population uses social media in 2023.
28. Social has annual growth of 5.1%, at an average rate of more than 7 new users every single second.
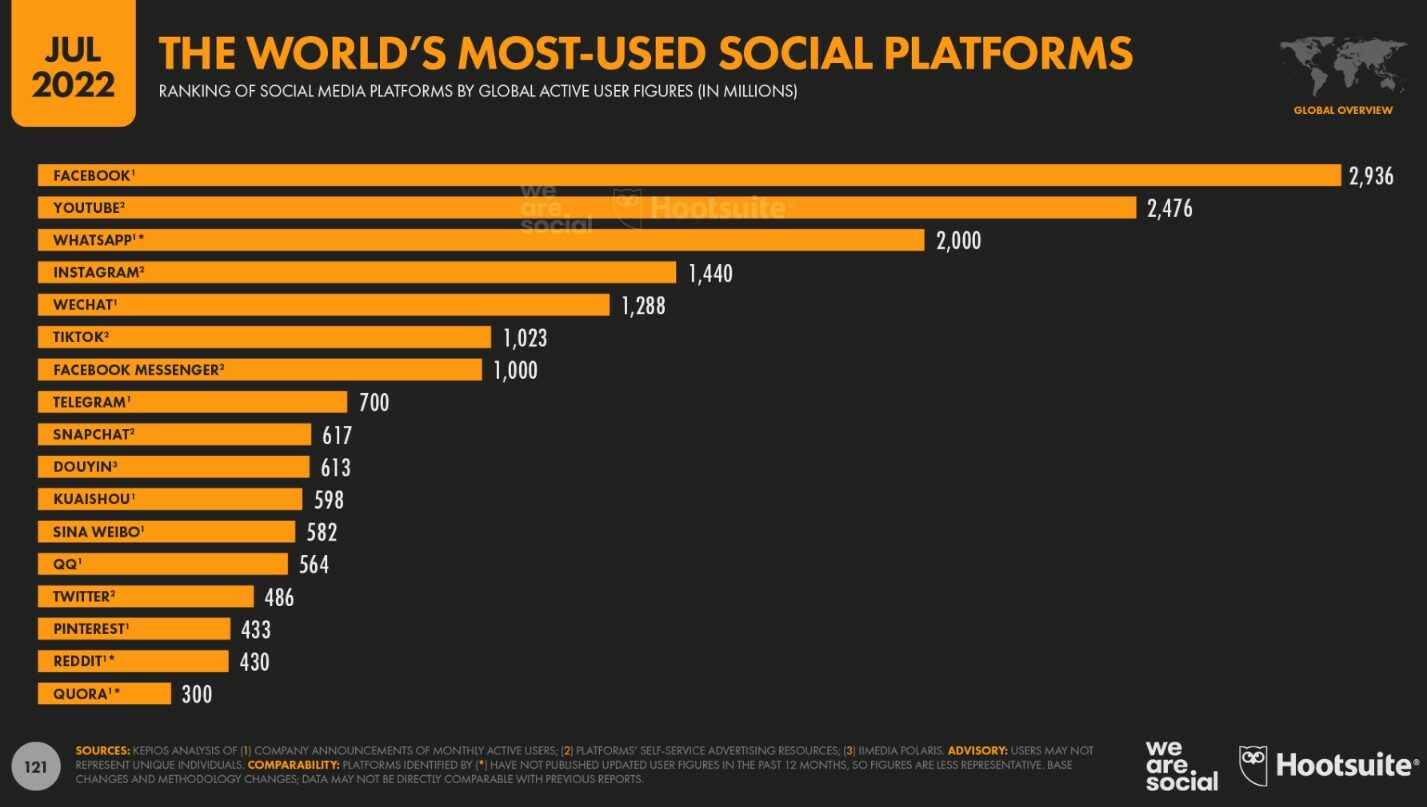
29. The world’s most-used social media platforms in 2022 were Facebook, YouTube, and WhatsApp.
Source: Dataportal
30. 76% of American consumers purchased a product after seeing a brand’s social post.
31. In 2022, people spent 147 minutes on average on social media.
32. 9 in 10 internet users use social media every month.
33. Facebook is the biggest social media platform in terms of user base. It has 2.91 billion users as of 2023.
34. 75% of the audience uses social media for product research.
35. 49% of social media users depend on and trust influencers for product recommendations.
36. There are 200 million+ businesses on Instagram.
37. Eastern Asia has the most social media users (26%) as of 2023.
38. The average number of social media accounts held by a millennial or Gen Z user around the world is 8.5.
39. Tweets with videos are 6x more likely to be retweeted than Tweets with photos and 3x more than Tweets with GIFs.
40. Twitter is one of the preferred social networks for news consumption.
41. TikTok is the most downloaded social media app in the US.
42. 90% of brands want to build brand awareness through social media, 77% of them use it to maintain brand reputation, while 71% of them use it for building and managing an engaged community.
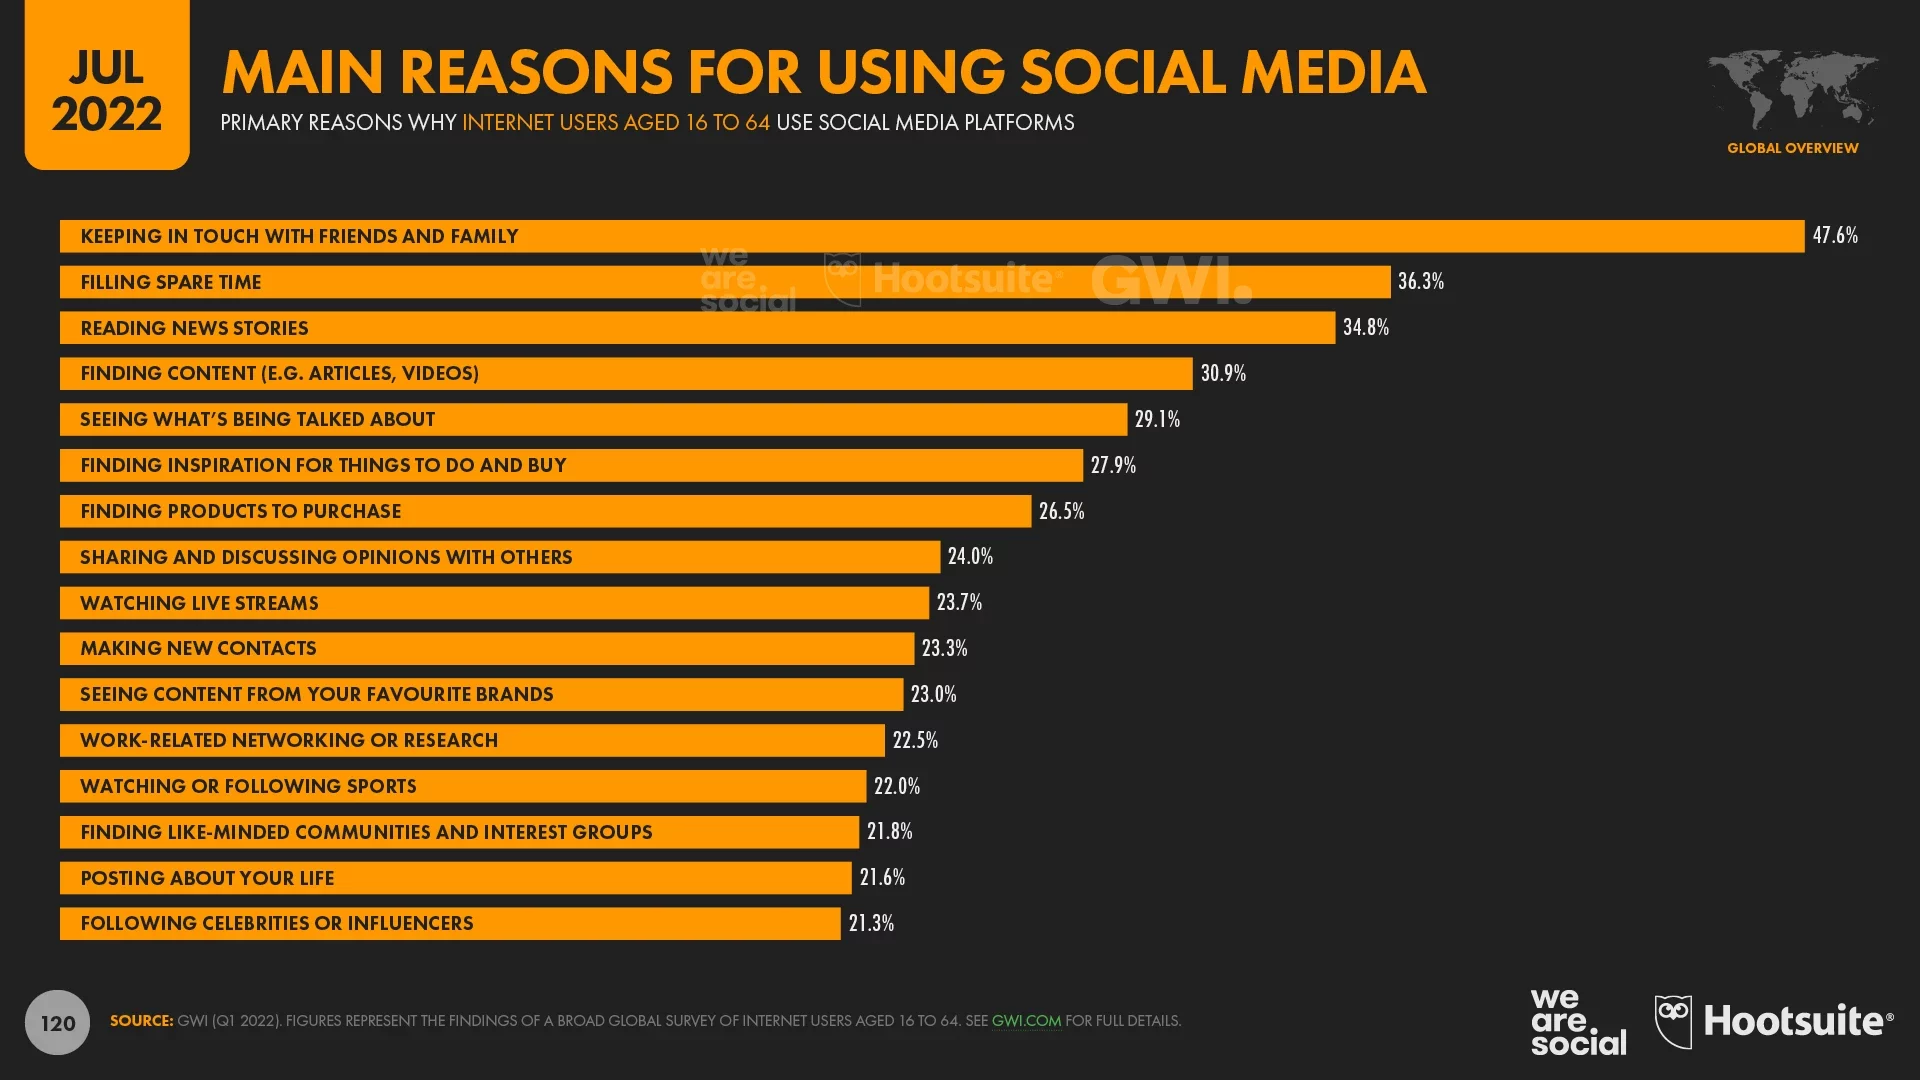
43. Main reasons for using social media are to keep in touch with friends and family, followed by filling spare time and reading news stories.
Source: Datareportal
44. An ad on LinkedIn can reach 14.6% of the world’s population.
45. Brands have seen a 33% increase in purchase intent resulting from ad exposure on LinkedIn.
46. Marketers see up to 2x higher conversion rates on LinkedIn.
47. In 2022, stats showed that companies put $177 billion toward social advertising in the U.S.
48. If someone signed up on a social platform at the age of 16 and they lived to 70, they would spend 5.7 years of their life using social media.
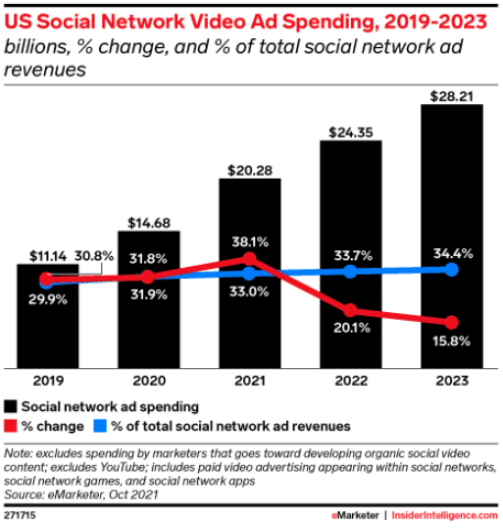
49. In 2023, social media video ad spending will grow by 15.8% to $28.21 billion.
Source: Insider Intelligence/eMarketer
50. 31% of all people in the world use YouTube today.
51. Instagram users spend 11.2 hours on the app each month.
Mobile Marketing Statistics 2023
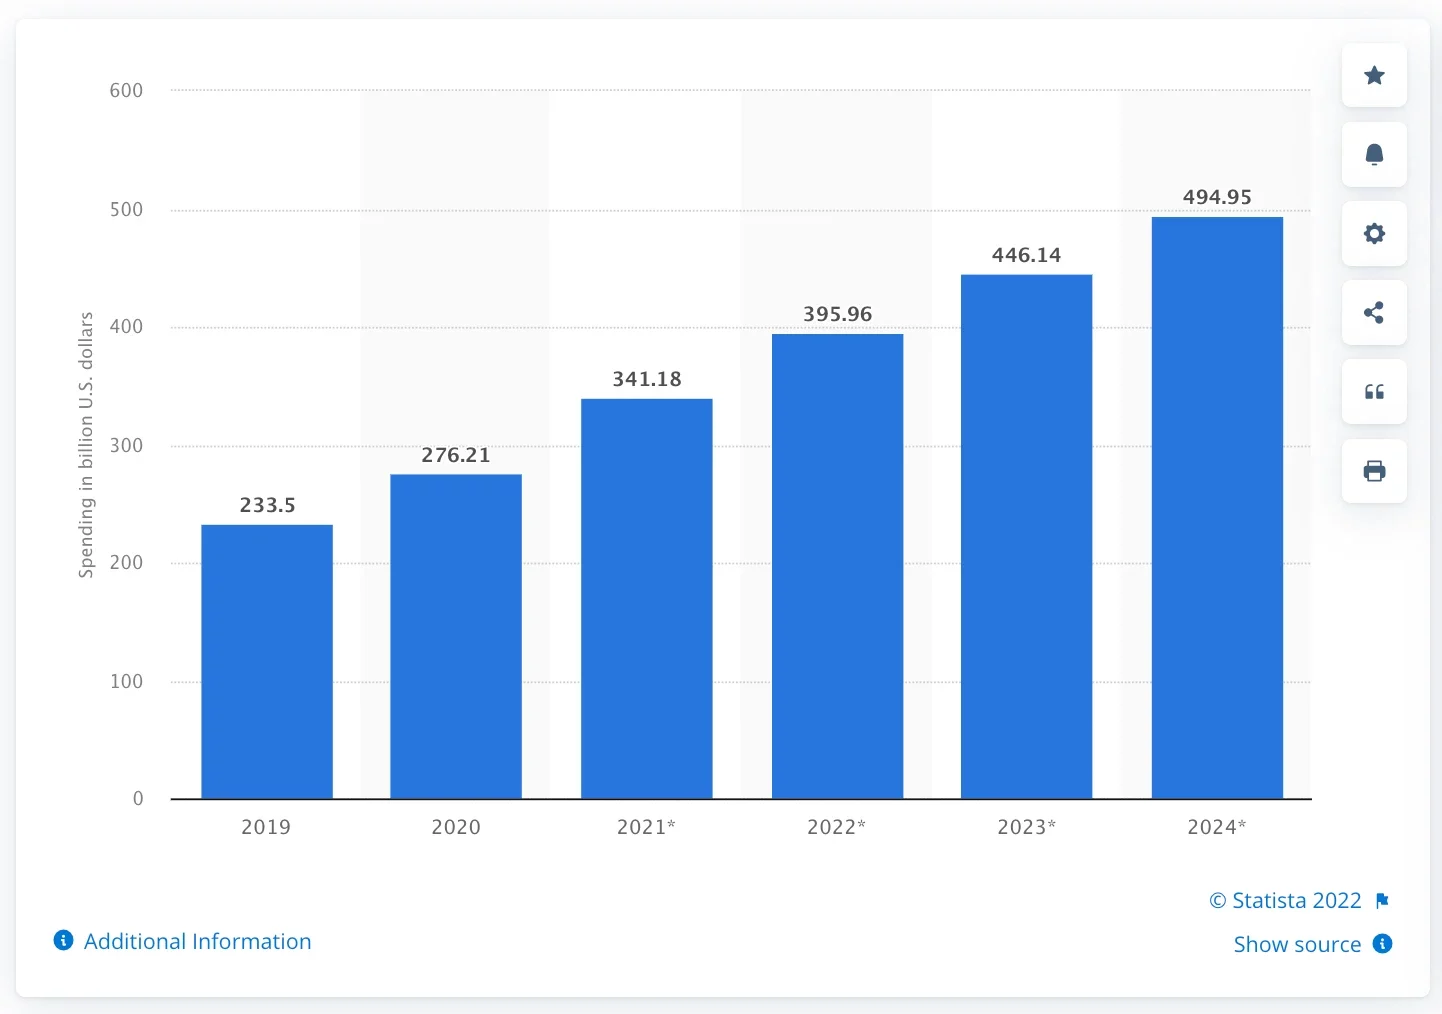
52. Global mobile internet advertising spending will surpass $400 billion in 2023.
Source: Statista
53. 94% of Facebook ad revenue comes from mobile.
54. Roughly 51% of all web traffic is mobile.
55. The United States is the world’s leader in mobile advertising spending.
56. 31% of retail spending was made on mobile devices in the U.S.
57. Of the total digital advertising spend worldwide, 60% is on mobile.
58. 93% use the internet on smartphones to discover local businesses.
59. On average, people spend around five hours a day on their smartphones.
60. People in the U.S. spend 49% of their phone time on social media apps.
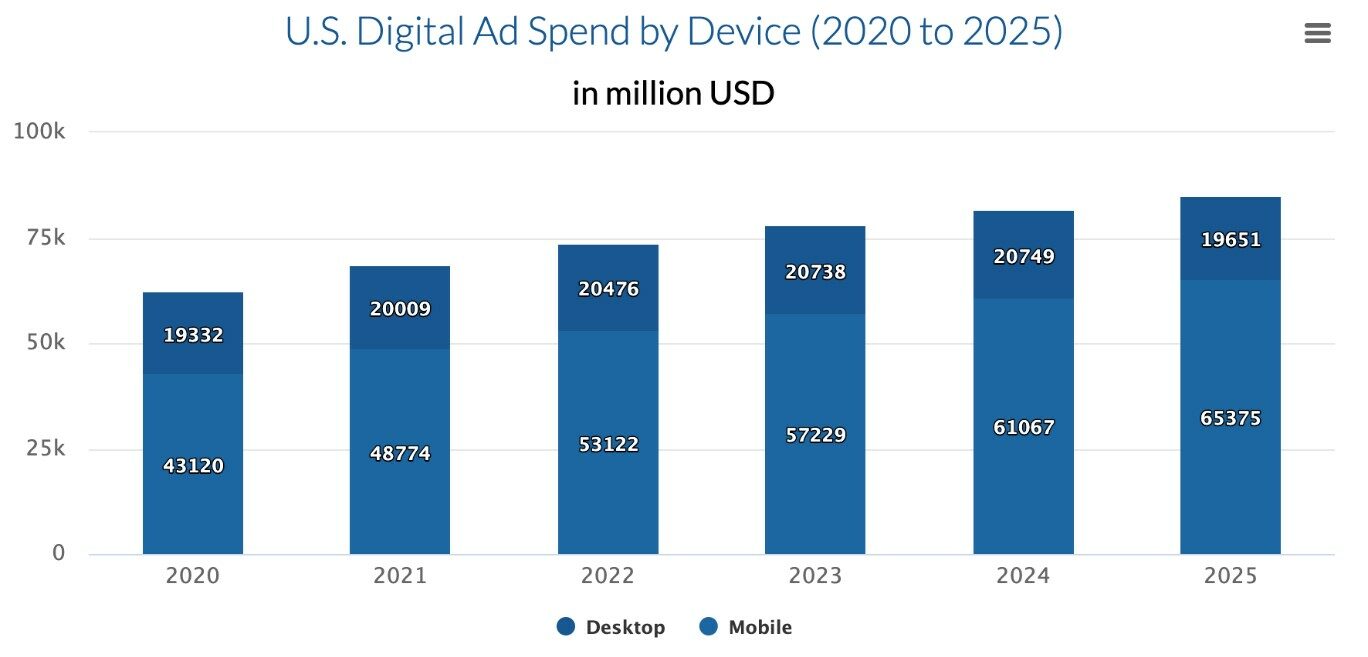
61. Mobile ad spend in the U.S. was always bigger than desktop ad spend. This trend will continue until 2025.
Source: Financesonline
62. When it comes to immediate needs, 3 out of 4 mobile users go to mobile search first.
63. 75% of Americans take their mobile device to the bathroom.
64. On mobile and desktop SERPs, the first page that ranks for a domain on a search is different 35% of the time.
65. More than 50% of small businesses have a mobile app.
66. You lose 61% of users if your site is not optimized for mobile.
67. 40% of users that have a bad experience with the mobile version of your website go directly to your competitor shortly after.
68. When searching on mobile, Google is the preferred choice of 96% of smartphone users.
69. There’s a 270% gap in conversion between desktop and mobile.
70. 69% of smartphone users said they would make purchases from businesses if their mobile websites addressed their queries or concerns.
71. 40% of shoppers consult 3 or more channels (often while shopping) before making a purchase.
72. 70% of mobile searches lead to online action within an hour.
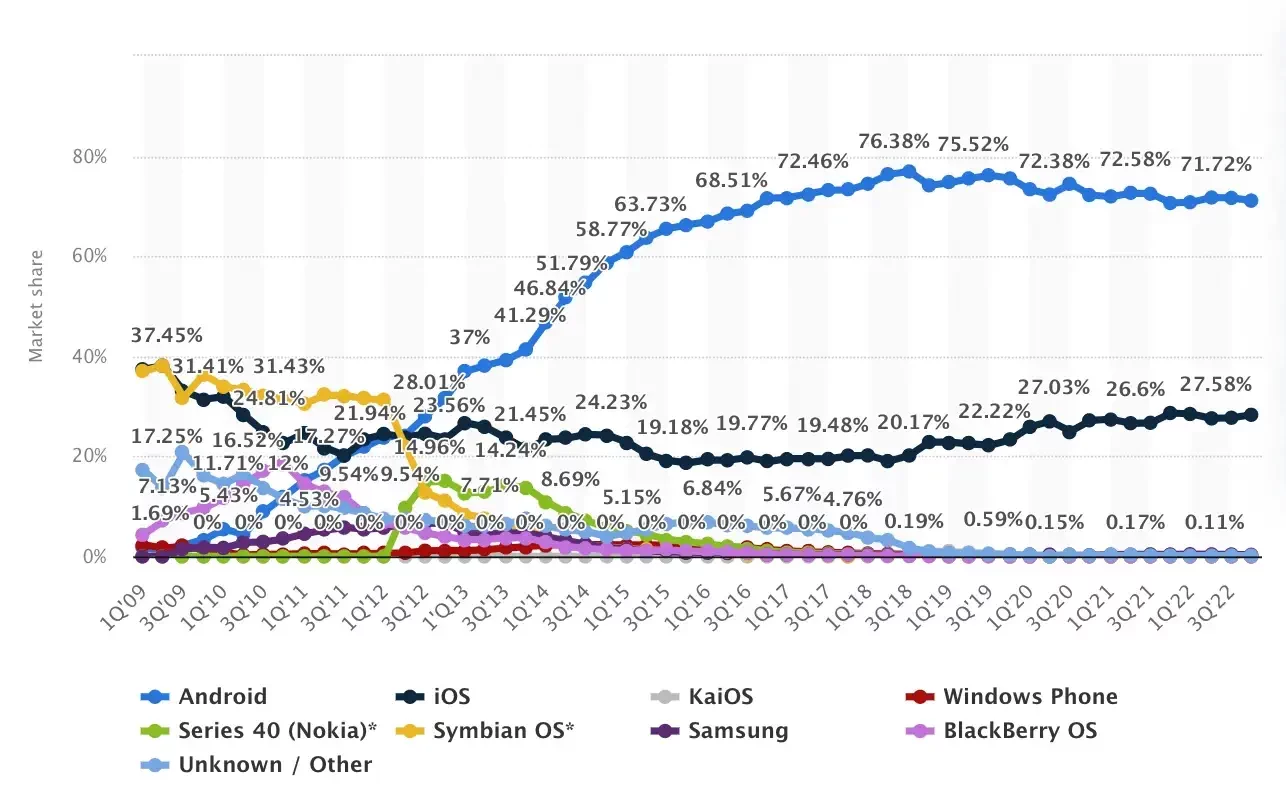
73. With a market share of 71.1%, Android is the world’s most popular mobile operating system.
Source: Statista
74. As many as 50% of mobile ad clicks are accidental.
75. 66% of emails are read on a smartphone or tablet.
76. 18% of Facebook users only use the platform on mobile
77. The average mobile session is 40 minutes.
Content Marketing Statistics 2023
78. 84% of organizations have a content marketing strategy.
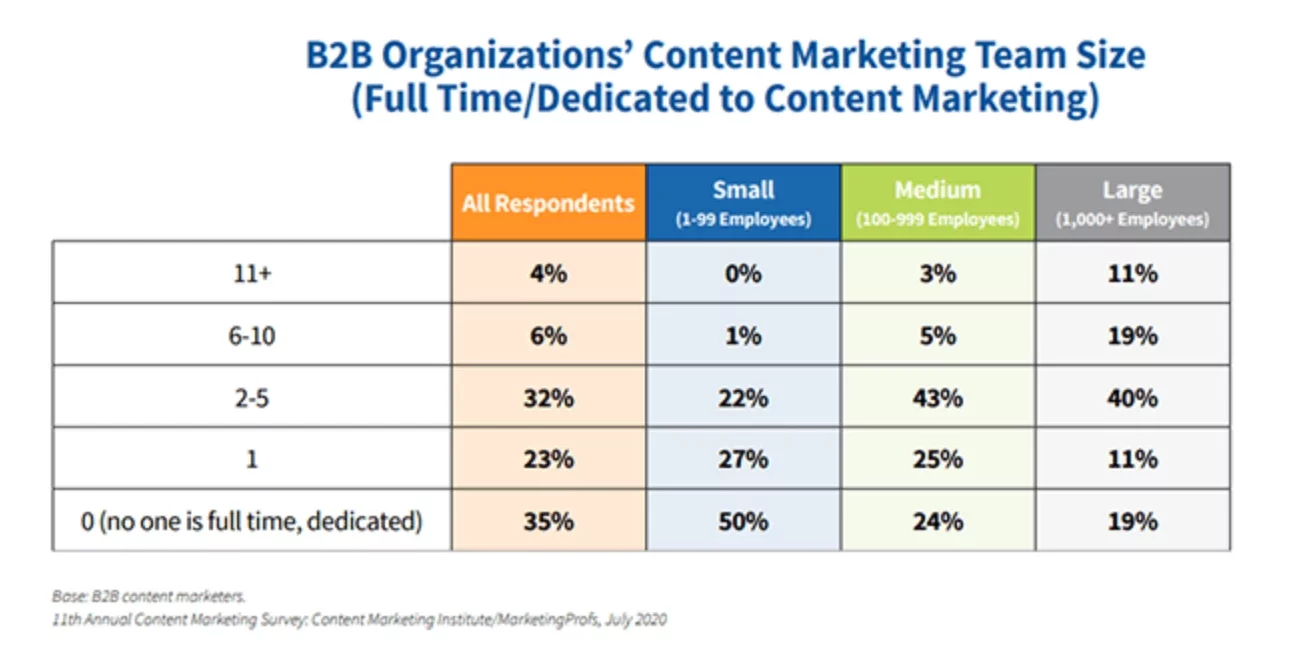
79. 35% of organizations don’t have dedicated content marketing teams.
Source: Startupbonsai
80. 82% of marketers are actively investing in content marketing, 10% report not using content marketing, and 8% are unsure if their company uses content marketing.
81. 40% of B2B marketers have a documented content marketing strategy, and 64% of the most successful B2B marketers have a documented content marketing strategy.
82. 73% of people admit to skimming blog posts, while 27% consume them thoroughly.
83. 51% of the businesses that invest in content marketing publish content every day.
84. Interactive content sees 52.6% more engagement than static content, with buyers spending an average of 8.5 minutes viewing static content items and 13 minutes on interactive content items.
85. Ryan Robinson reports the average reader spends 37 seconds reading a blog.
86. Short articles/posts of fewer than 3,000 words (83%) and videos (61%) are the top two content types that B2C marketers used in the last 12 months. These two also produce the best results.
87. In addition to using their organization’s website to distribute content in the last 12 months, more than 50% of B2C respondents used blogs, email newsletters, and email.
88. 93% of content marketers believe that video converts the same or better than other forms of content.
89. Among the B2C marketers who used paid social media platforms, the majority chose Facebook (91%) and Instagram (59%). Respondents said Facebook produced the best results.
90. There are over 600 million blogs online as of 2023.
91. 44% of users consume 3-5 pieces of content before engaging with a business.
92. At least one piece of content is created every day by 60% of marketers.
93. Consistently creating engaging visual content is the biggest struggle for 36.7% of marketers.
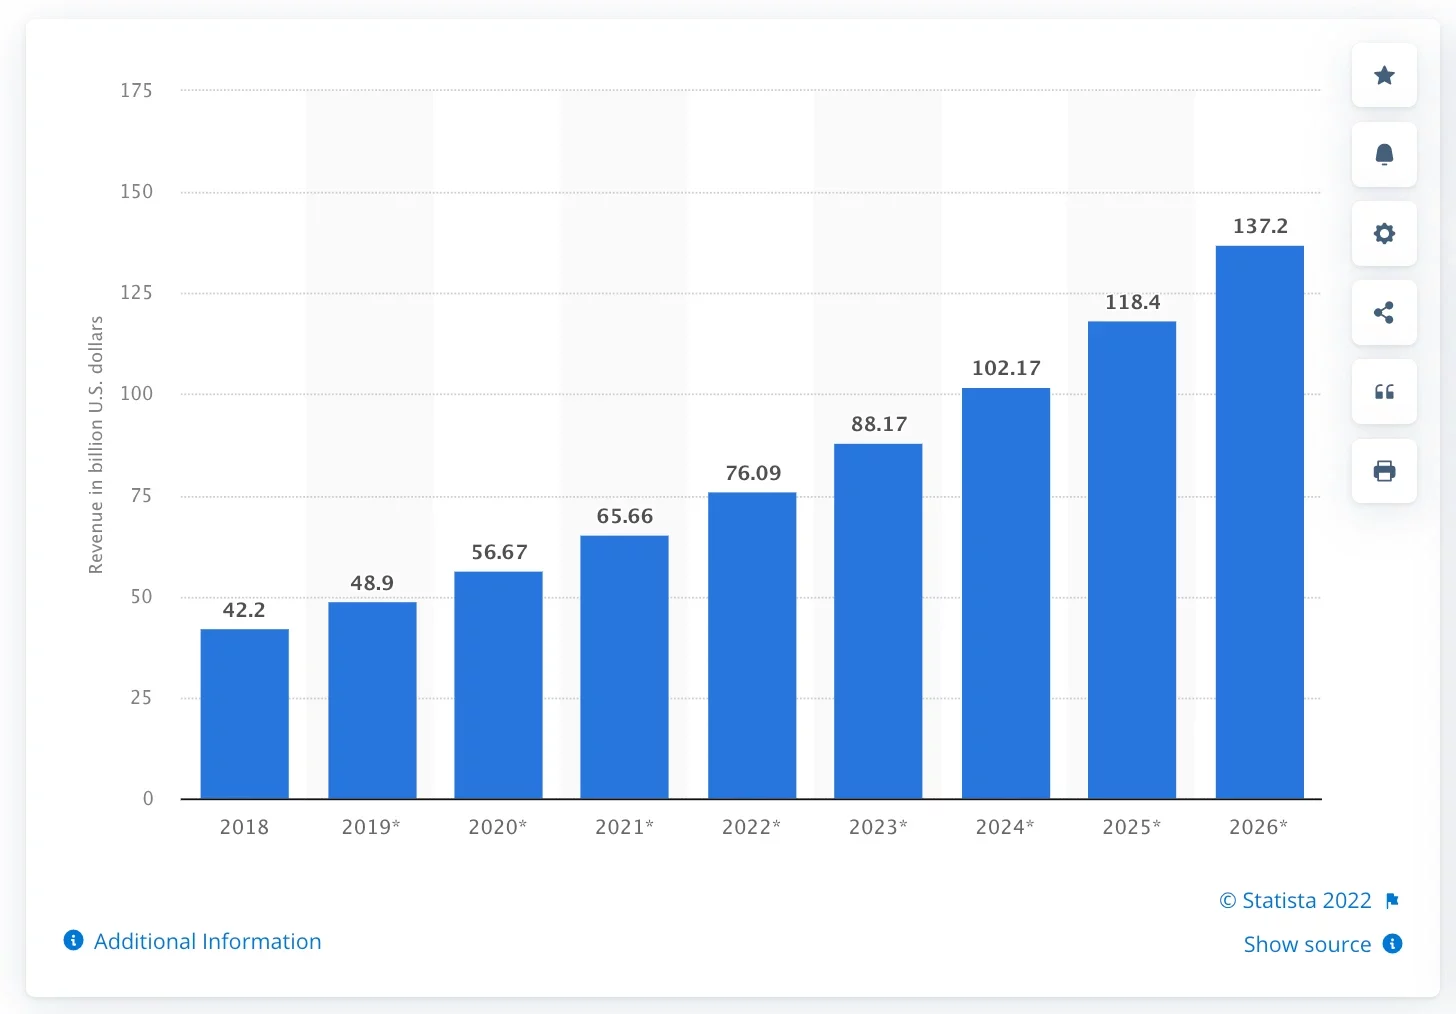
94. It is projected that content marketing revenue in 2023 will be $88 billion.
Source: Statista
95. 79% of companies use content marketing to generate quality leads.
96. Consumers are looking for interactive content.
97. 76% of content marketers use organic traffic as a key metric to measuring content success. Only 22% use backlinks.
98. 94% of content marketers are using social media as a distribution channel for their content.
99. 79% of organizations have 1 to 10 people creating content.
100. The majority of marketers (62%) look at page views to know how well their content is performing.
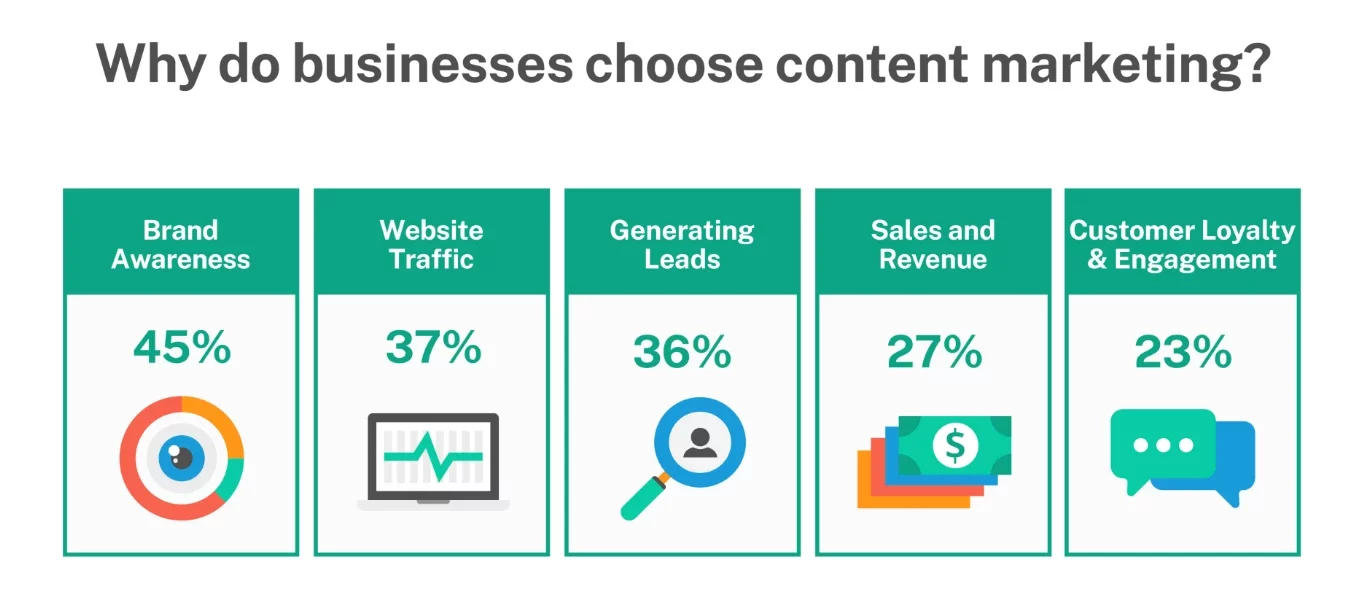
101. 45% of businesses choose content marketing for brand awareness.
Source: Expertmarket
102. The top technologies used by content marketing teams are social media posting (65%), website analytics tools (50%), and email marketing software (44%).
103. WordPress is the number one content management system used by marketers.
Email Marketing Statistics 2023
104. There are 4 billion daily email users.
105. A majority of marketers using email leverage mobile-friendly emails as part of their marketing strategy.
106. Active email accounts are expected to hit 4.48 billion users in 2024.
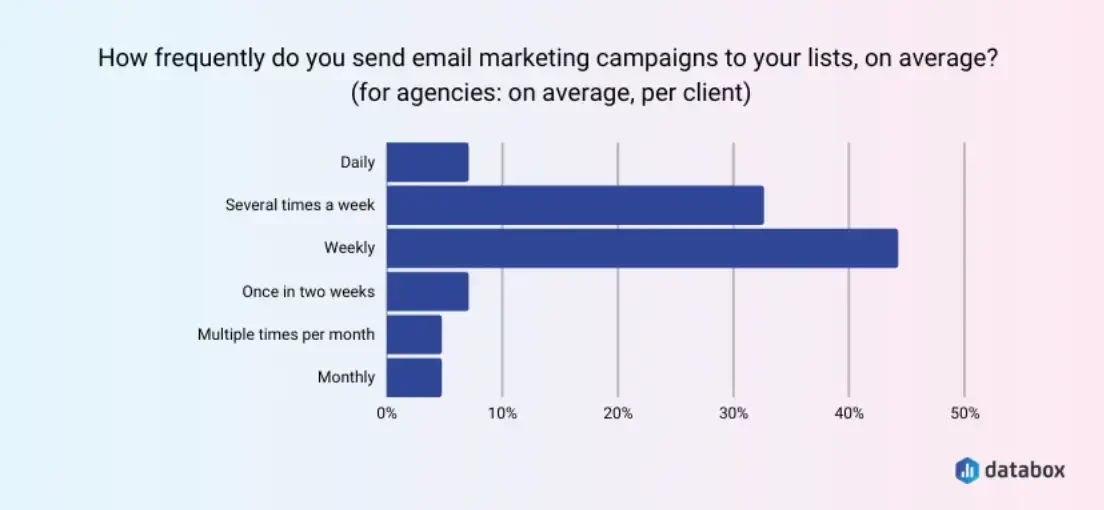
107. 33% of marketers send weekly emails and 26% send emails multiple times per month.
108. 77% of marketers have seen an increase in email engagement over the last 12 months.
109. 69% of marketers use email marketing to distribute their content.
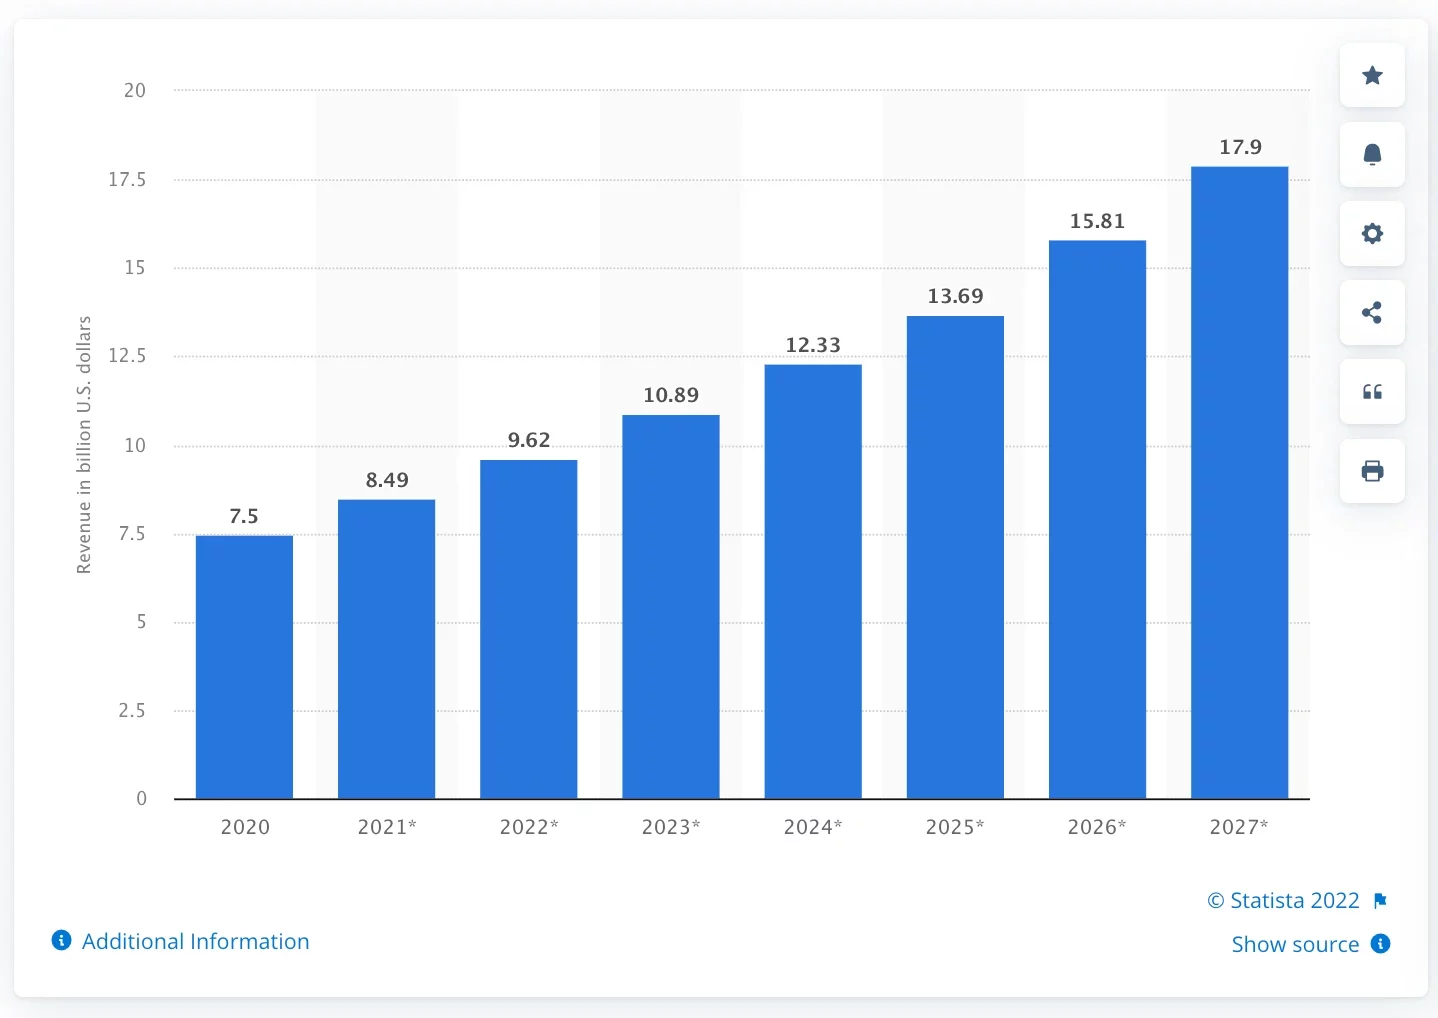
110. Worldwide email marketing revenue is expected to go over $10 billion in 2023.
Source: Statista
111. 81% of B2B marketers say their most used form of content marketing is email newsletters.
112. When evaluating content performance, 47% of B2B marketers rely on email engagement.
113. Globally, Mondays see the highest email open rates (22%), compared to the lowest open rates on Sundays (20-3%).
114. Best day with highest click-through rates is Tuesday (2.4%).
115. 92% of adults that are online use email, with 61% using it on an average day.
116. 45% of marketers send emails for their email marketing campaigns on a weekly basis.
Source: Databox
117. 30% of marketers still send the same volume of emails to users regardless of engagement.
118. 99% of email users check their inbox every day, with some checking 20 times a day.
119. 61% of consumers prefer to be contacted by brands through email.
120. Plain-text emails have higher performance, even though most respondents stated they preferred image-based HTML emails.
121. Nearly 42% of all email opens happen on mobile apps.
122. 55% of respondents say email marketing is the most often automated channel.
123. The highest average email open rate registered in any industry is 28.72% in media and entertainment
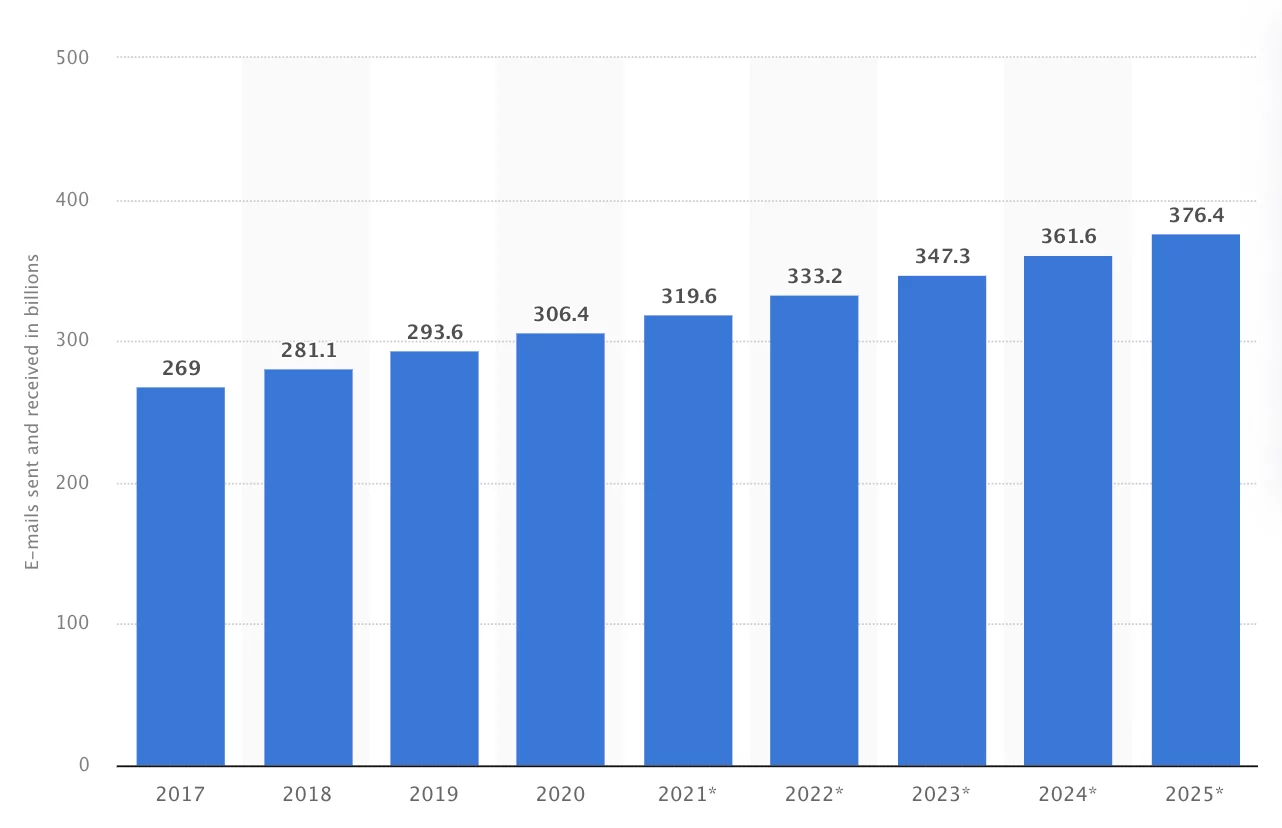
124. 333 billion emails were sent and received worldwide in 2022.
Source: Statista
125. 61% of consumers enjoy receiving promotional emails weekly.
126. Segmented emails make readers 50% more likely to click on a link within the email.
127. 99% of email users check their email every day, some as much as 20 times a day.
128. 86% of business professionals prefer to use email when communicating for business purposes.
Blogging Statistics 2023
129. Approximately 4.4 million blog posts are created every day.
130. Adding a blog to your existing website can increase traffic by as much as 434%.
131. 77% of internet users read blogs.
132. The average blog post is 2,330 words.
133. Seven-minute reads attract the most attention from the internet audience.
134. The top blogs make over $1m+ per year.
135. 92% of content marketers use blog posts as part of their strategy
136. Experts recommend writing blog posts that have between 1,760 and 2,400 words.
137. 54% of bloggers work with editors, while 46% edit their own posts.
138. Businesses with blogs get 97% more inbound links.
139. There are roughly 70 million new WordPress blog posts published each month.
140. 22% of bloggers post 2-3 times per week.
141. 67% of bloggers that post once per day report excellent results.
142. The most popular types of content produced are blog posts (85%) and infographics (61%), followed by social sharing assets (56%).
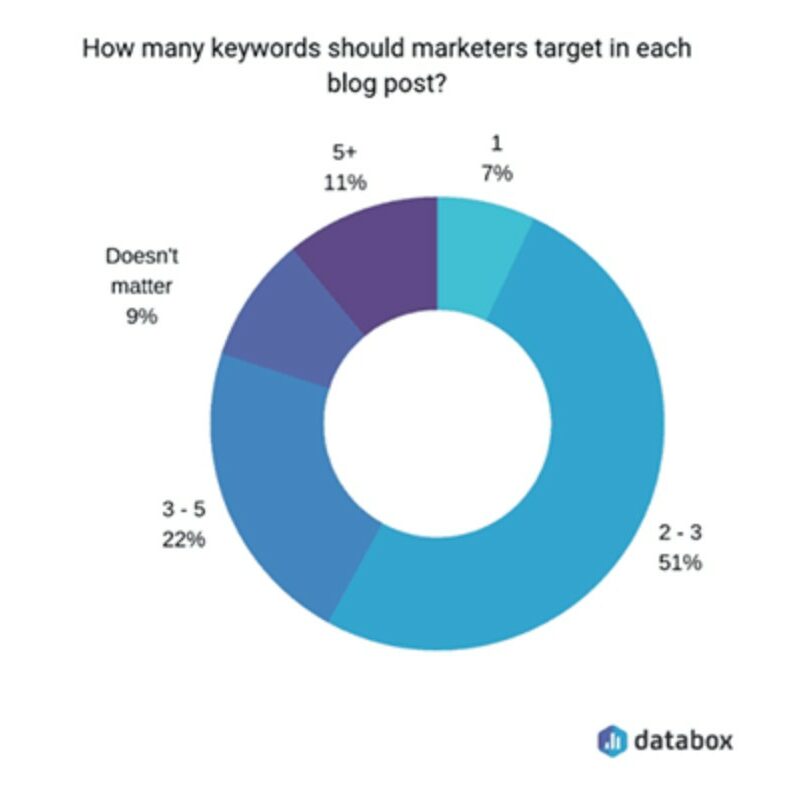
143. Most experts think marketers should target 2-5 keywords in each blog post.
Source: Startupbonsai
144. 43% of all websites use WordPress as the content management system.
145. 47% of all blogs have 2-3 images.
146. 65% of companies who say their content marketing is very successful, do content audits more than twice a year.
147. Having content that’s backed by data is 73% more persuasive than publishing a post without one.
148. Longer (3,000 to 10,000 words) posts get the most shares.
149. 23% of bloggers reported that they need 2–3 hours to write a blog post.
150. Bloggers need an average of 3.5 hours for a single blog post.
151. 23% of social media posts now include a link to a blog post.
152. 82% of marketers who blog consistently see positive ROI from inbound links and increased rankings in search engines.
153. 60% of consumers feel connected to a brand after reading custom content.
Digital Marketing Fun Facts
154. Google receives over 77,000 searches per second.
155. 70% of consumers prefer blog posts to ads.
156. Digital ads can increase a brand’s awareness by 80%.
157. The U.S. digital advertising and marketing market is currently estimated at $460 billion.
158. PPC returns $2 for every $1 spent — resulting in a 200% ROI.
159. Paid ad channels with the highest reported ROI rate are Facebook Ads and Google Ads.
160. 72% of overall marketing budgets get put towards digital marketing channel
161. There are 55 million companies on LinkedIn.
162. The average business professional is sending and receiving 121 emails a day! That’s an awful lot of information to ignore!
Note: Please link back to OmnicoreAgency.com and this page when you reference/quote the statistic.
Photo Credit: Unsplash


